Risk doesn’t emerge from policies, routes, or plans. It emerges from where vehicles actually operate, when they’re on the road, and how they interact with their environment.
Yet many of the most consequential decisions in insurance, fleet management, and urban mobility are still made using static or lagging inputs. Claims arrive long after incidents occur. Garaging locations are used as proxies for operating exposure. Broad classifications flatten meaningful differences between dense urban corridors, arterial roads, and long rural stretches.
The result is a persistent blind spot:
Real-world exposure diverges from the data used to assess it.
For insurers, this creates mispriced risk and adverse selection. For fleets, it obscures where safety investment would matter most. For cities, it delays action until problems are already visible in crash statistics.
This is the challenge Nexar Risk Index™ is designed to address.
From Historical Records to Live Operating Reality
Traditional risk models are built backward. They infer future exposure from historical outcomes - often months or years old - and assume operating conditions remain stable.But roads don’t behave that way.
Traffic composition shifts. Construction re-routes flow. Seasonal patterns alter congestion. Driver behavior changes under pressure. Risk is dynamic, spatially uneven, and highly sensitive to context.Nexar Risk Index™ flips the model.
Instead of waiting for loss to surface, it transforms millions of real-world driving and road context events into a continuously updated risk signal - grounded in where vehicles actually travel, how drivers drive, and how context changes over time.
This makes risk observable before policies are bound, routes are finalized, or infrastructure decisions are locked in.
The Data Foundation Behind Risk Index™
Nexar’s advantage lies in its ability to observe driving behavior continuously and at scale. Each month, the platform reflects more than 130 million kilometers driven and 5.4 million hours of operation, providing a current and persistent view into how exposure forms across real-world environments. Coverage spans diverse geographies, vehicle types, and operating contexts, ensuring risk assessments reflect present conditions rather than outdated historical averages.
Rather than relying solely on rare or delayed outcomes, Nexar Risk Index™ draws on large volumes of real-world driving activity to capture how risk develops across different operating conditions. The system integrates signals that describe where vehicles operate, how they are used, and the environmental and temporal contexts in which driving occurs.
Nexar Risk Index™ is envisioned as a signal-agnostic, continuously evolving risk framework. It is designed to incorporate relevant behavioral, environmental, and contextual signals as they emerge, while maintaining consistency, explainability, and statistical stability. This ensures the index remains regulator-friendly and suitable for underwriting, actuarial analysis, and long-term risk planning, even as mobility patterns, infrastructure, and driving environments change.
How Nexar Risk Index™ Works
Nexar’s position as a real-world driving data platform enables three capabilities that static or claims-based systems cannot deliver.
1. Expected Risk by Driver and Operating Context
Rather than relying on coarse driver or vehicle categories, Nexar Risk Index™ evaluates risk based on how different driver profiles operate across real conditions.
This includes distinctions between personal drivers, rideshare operators, and commercial and truck fleets, and how their exposure shifts with time of day, traffic patterns, and operating environments. Because these profiles are derived from observed driving activity at scale - not self-reported attributes or historical claims - the resulting risk signal reflects behavioral and contextual reality, not classification proxies.
2. Geographic and Exposure-Based Integration
Risk is inseparable from place.
A vehicle operating primarily on rural interstates experiences fundamentally different conditions than one navigating dense urban cores, ports, construction corridors, or last-mile delivery zones. Nexar Risk Index™ explicitly accounts for this by integrating where vehicles operate and how much time they spend there.
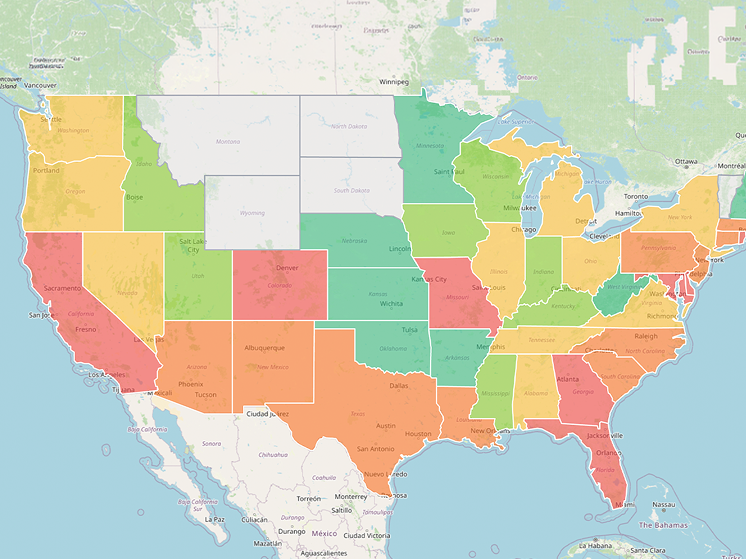
By combining regions of operation with measured exposure, the platform reveals how risk concentrates across states, counties, cities, and neighborhood-level areas. Interactive heatmaps make these patterns visible, highlighting elevated exposure and environmental complexity that are invisible in aggregated statistics or static territory definitions. This exposure-normalized view ensures geographic risk remains comparable, stable, and suitable for pricing and planning.
3. Immediate, Pre-Decision Availability
Traditional risk signals are slow by design. Claims emerge long after exposure occurs, and many telematics or video solutions require installation, calibration, and extended observation before producing usable insight.
Nexar Risk Index™ is available immediately. Because it is built on continuously collected, population-level driving data, the index does not depend on individual history or operational changes. This allows underwriters, fleet managers, and planners to access credible risk intelligence at the moment decisions are made - during quoting, route planning, market entry, expansion analysis, or infrastructure assessment - without slowing workflows or adding operational friction.
Practical Applications Across the Mobility Ecosystem
For Insurance Organizations
Pre-Bind Risk Stratification
Underwriters can differentiate risk by actual operating geography, exposure hours, and driver profile before binding coverage. This enables more nuanced appetite management - accepting exposure in lower-risk corridors while adjusting pricing or limits in higher-loss zones.
New Accounts and Limited History
New fleets and owner-operators often lack sufficient claims data to price confidently. Nexar Risk Index™ benchmarks proposed operations against similar real-world exposure patterns, enabling informed decisions where traditional underwriting struggles.
Targeted Monitoring Programs
Nexar Risk Index™ can act as an early indicator for where telematics or video programs will deliver the highest return - focusing deeper monitoring on accounts with elevated exposure rather than deploying hardware indiscriminately.
For Fleets and Operators
Route and Market Evaluation
Fleets gain visibility into how risk varies by lane, metro area, and operating schedule. This supports smarter routing decisions, contract evaluation, and safety investment planning.
External Risk Benchmarking
Instead of relying solely on internal incident data, fleets can compare their exposure against broader market conditions - identifying whether elevated risk stems from behavior, environment, or both.
For Cities and Public Agencies
Proactive Risk Identification
Nexar Risk Index™ surfaces geographic patterns of elevated exposure and near-incident pressure before they manifest as crashes. This supports earlier interventions, targeted infrastructure changes, and data-driven prioritization.
Understanding Change Over Time
Historical trend analysis reveals how risk shifts with construction, policy changes, seasonality, or traffic growth - enabling cities to measure the impact of interventions and adapt strategies dynamically.
Institutional Impact on Decision-Making
Beyond individual use cases, Nexar Risk Index™ changes how organizations reason about risk.
It introduces a shared, continuously updated reference point that underwriting, operations, planning, and leadership can rely on simultaneously.
A Common Operating Language
When exposure is measured consistently across territories and time, teams no longer debate whose dataset is correct. Pricing, routing, capital allocation, and safety planning can align around the same observable reality.
Greater Defensibility
Because the methodology is grounded in real-world measurement rather than assumption or proxy, decisions become easier to explain to regulators, partners, and stakeholders. The conversation shifts from interpretation to evidence.
Stability Amid Change
Mobility environments evolve constantly. Construction, demand shifts, policy changes, and traffic composition alter exposure faster than traditional models can adapt. A continuously refreshed signal allows organizations to adjust without rebuilding frameworks from scratch.
Autonomous Readiness and Exposure Intelligence
The requirement emerging in autonomy is the same one transforming insurance and fleet operations: continuous understanding of risk in live environments.
Autonomous systems rarely fail in theory. They fail in context - at particular intersections, within specific traffic compositions, under moments of behavioral pressure.
Addressing those realities requires more than simulation or closed-course validation. It requires persistent, population-scale visibility into how complexity develops on actual roads.
Because Nexar observes mobility continuously and at scale, Nexar Risk Index™ becomes a living map of exposure: where friction accumulates, where near-incidents cluster, and where conditions trend toward instability.
These insights extend far beyond underwriting. They guide:
- where additional safeguards may be required
- which corridors present elevated interaction complexity
- how infrastructure changes alter behavioral dynamics
- where early intervention can reduce the probability of failure
In this way, Nexar Risk Index™ is not only a tool for today’s decisions. It becomes infrastructure for responsible deployment.
The bridge from human driving intelligence to autonomous safety rests on a single principle:
See risk as it forms, not after it resolves.
From Observation to Obligation
Mobility systems are entering an era where decisions must be justified not only by outcome, but by evidence available before action is taken.
Nexar Risk Index™ now provides that evidence.
By making exposure continuously observable, organizations gain the ability to act earlier, align internally, and demonstrate responsibility externally. What begins as better underwriting or smarter routing becomes something larger: a durable foundation for how risk is understood across the mobility ecosystem.
When real-world conditions are measurable at population scale, reacting after failure is no longer sufficient.
The standard becomes knowing in advance.
Ready to understand how risk behaves in the environments you care about?
Explore Nexar Risk Index™ and experience real-world exposure intelligence in action.