Overview
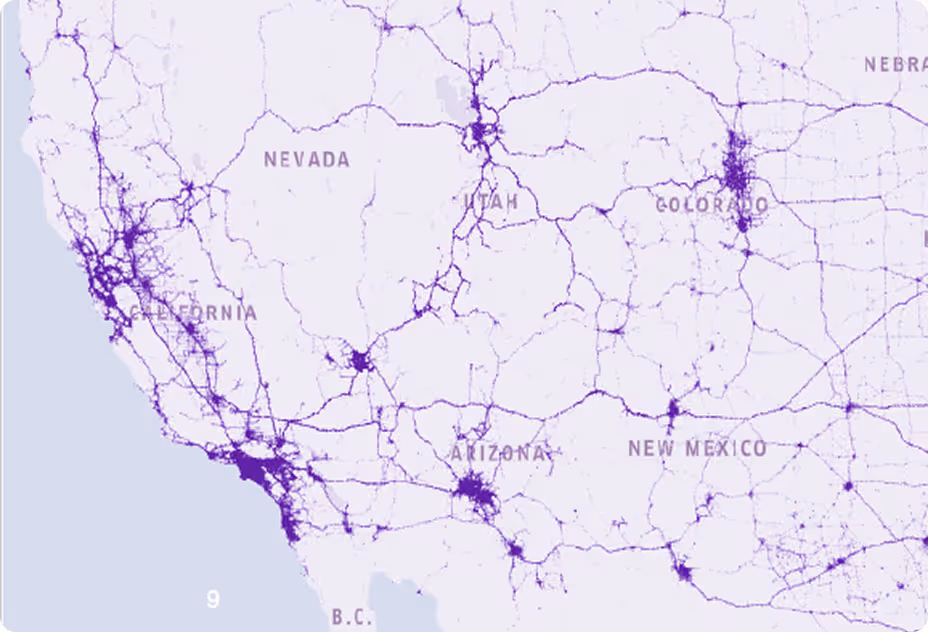
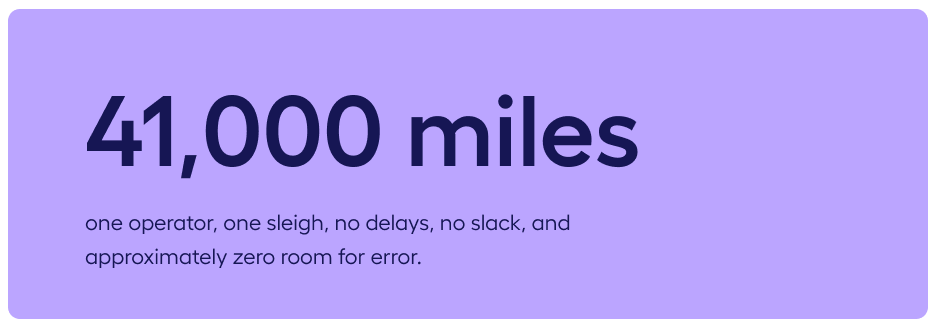
Every December 24th, Santa performs a logistics maneuver that would make any fleet operator sweat:
Magic covers the physics. Reality covers everything beneath it. We applied Nexar’s behavioral analytics, risk modeling, and weather-layer interpretation to Santa’s route — not to question the magic, but to understand the world he has to fly through.
Holiday Week Volatility Signals: The World Before Santa Takes Off
Santa flies at night. But nighttime conditions are shaped in the afternoon - and the week before Christmas is anything but calm.
Nexar’s data shows a pronounced rise in incident propensity during the late-afternoon window
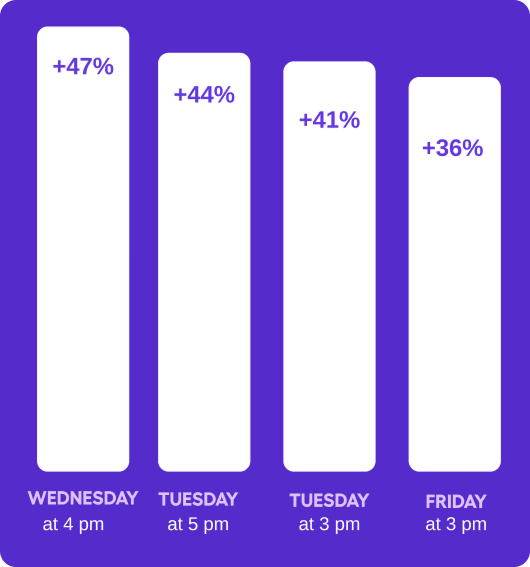
These aren't just numbers - they’re environmental precursors:
- Rush-hour braking becomes rooftop vibration and uneven ice layers
- Congestion pockets become heat plumes that warp nighttime air
- Sudden temperature drops become late-night black ice
- Errand surges leave airflow disturbances below sleigh altitude
Santa doesn’t fly during the spike - He flies through its consequences.

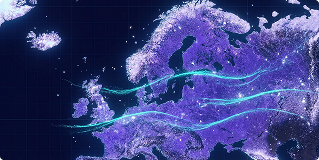
Weather Volatility Across Santa’s Route (A Global Forecast He Actually Needs)
East Asia - Jet Stream Whiplash
Snow bands + strong jet streams = sleigh wobble risk. Rooftop accuracy drops by a measurable margin.

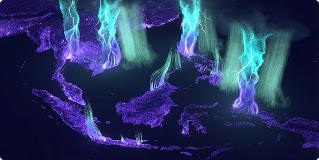
Southeast Asia - Thunderstorm Towers
Convective cells produce microbursts. Great for altitude. Terrible for gift stability.
Northern Europe - Crosswinds + Freeze Cycles
When roofs turn into black-ice runways, sleigh traction becomes a non-zero concern.
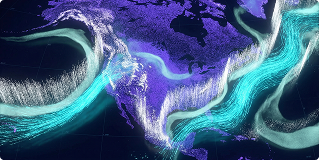
North America - Snow Curtains & Atmospheric Rivers
Visibility fluctuates dramatically. Santa’s comment (allegedly): "Perfect. Exactly what I needed tonight."
Australia - Thermal Turbulence
Summer thermals create upward boosts that reindeer “notice.”

Landing Difficulty Index (Yes, Rooftops Matter)
Buildings are as diverse as driving behavior. So we scored global rooftops the same way we score infrastructure complexity:
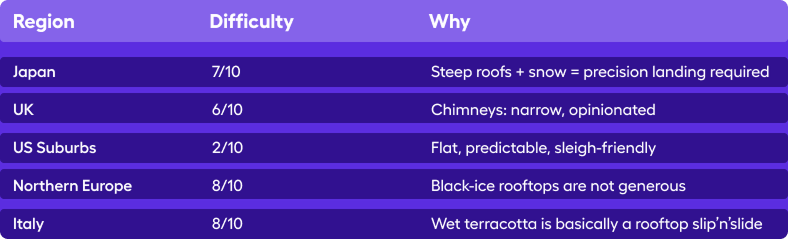
Santa deals with architecture the same way AVs deal with intersections:
NO TWO ARE THE SAME.
Optimizing Santa’s Global Route
(Because Even Magic Benefits From Data)
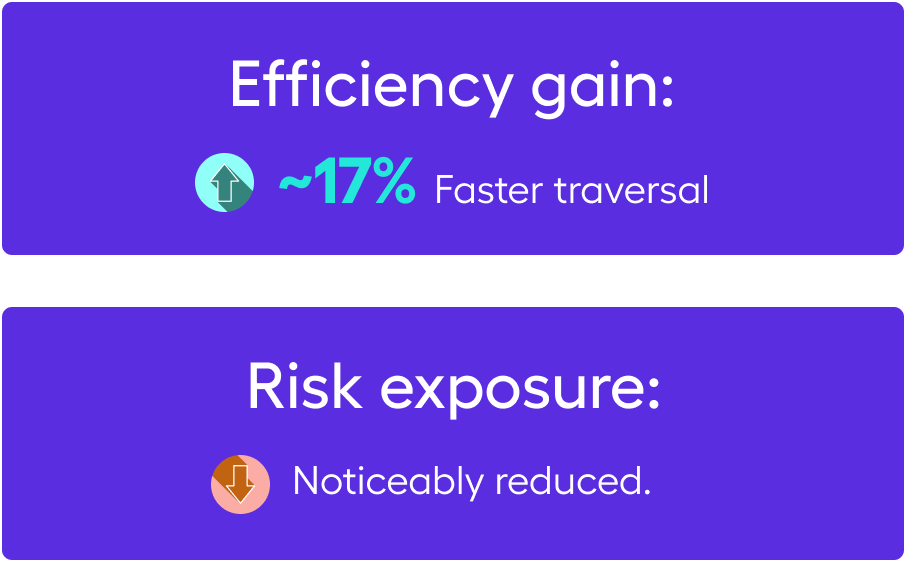
After sharing all of this with the Man in Red himself, he asked us what steps he can take, Which is when we took his normal route, and treated like a real routing problem - weather layers, behavioral volatility, and regional difficulty included - Upon which we offered some alternatives
Our modelled best sequence:
Rush-hour braking becomes rooftop vibration and uneven ice layers
- Oceania – Calm entry corridor
- East Asia – Take the weather gap
- India → Middle East – Stable airflow
- Europe – Best roof stability from 1–4 am
- Africa – Fastest clear-air traversal
- South America – Thermal lift = bonus speed
- North America – Last, when the daytime volatility has settled
Santa still bends time - but data smooths his path.
Conclusion
Santa’s annual journey looks magical from the ground. From above, it’s shaped by the same physics, behaviors, weather fronts, and volatility signals that guide every modern mobility system.
Magic gets Santa across the sky. Data gets everyone else home safely - and helps Santa shave a few minutes off the global loop.
If your holiday logistics require more signal and fewer miracles, Nexar’s ready.

Want to dive deeper?
Nexar helps industry leaders turn vision into value. Dive into real-world success stories where our data redefined the road ahead - and see what it can do for you.