Executive Summary
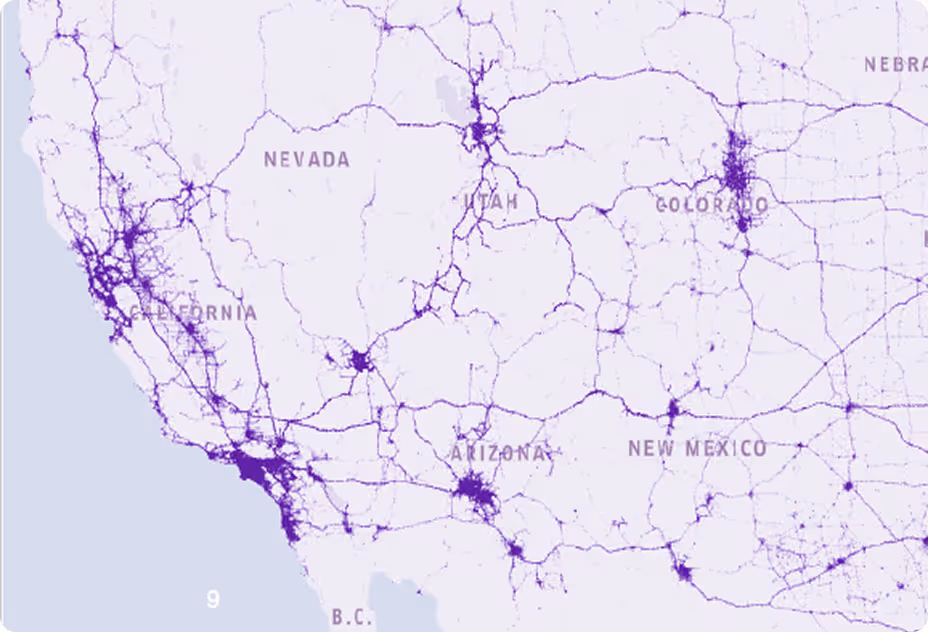
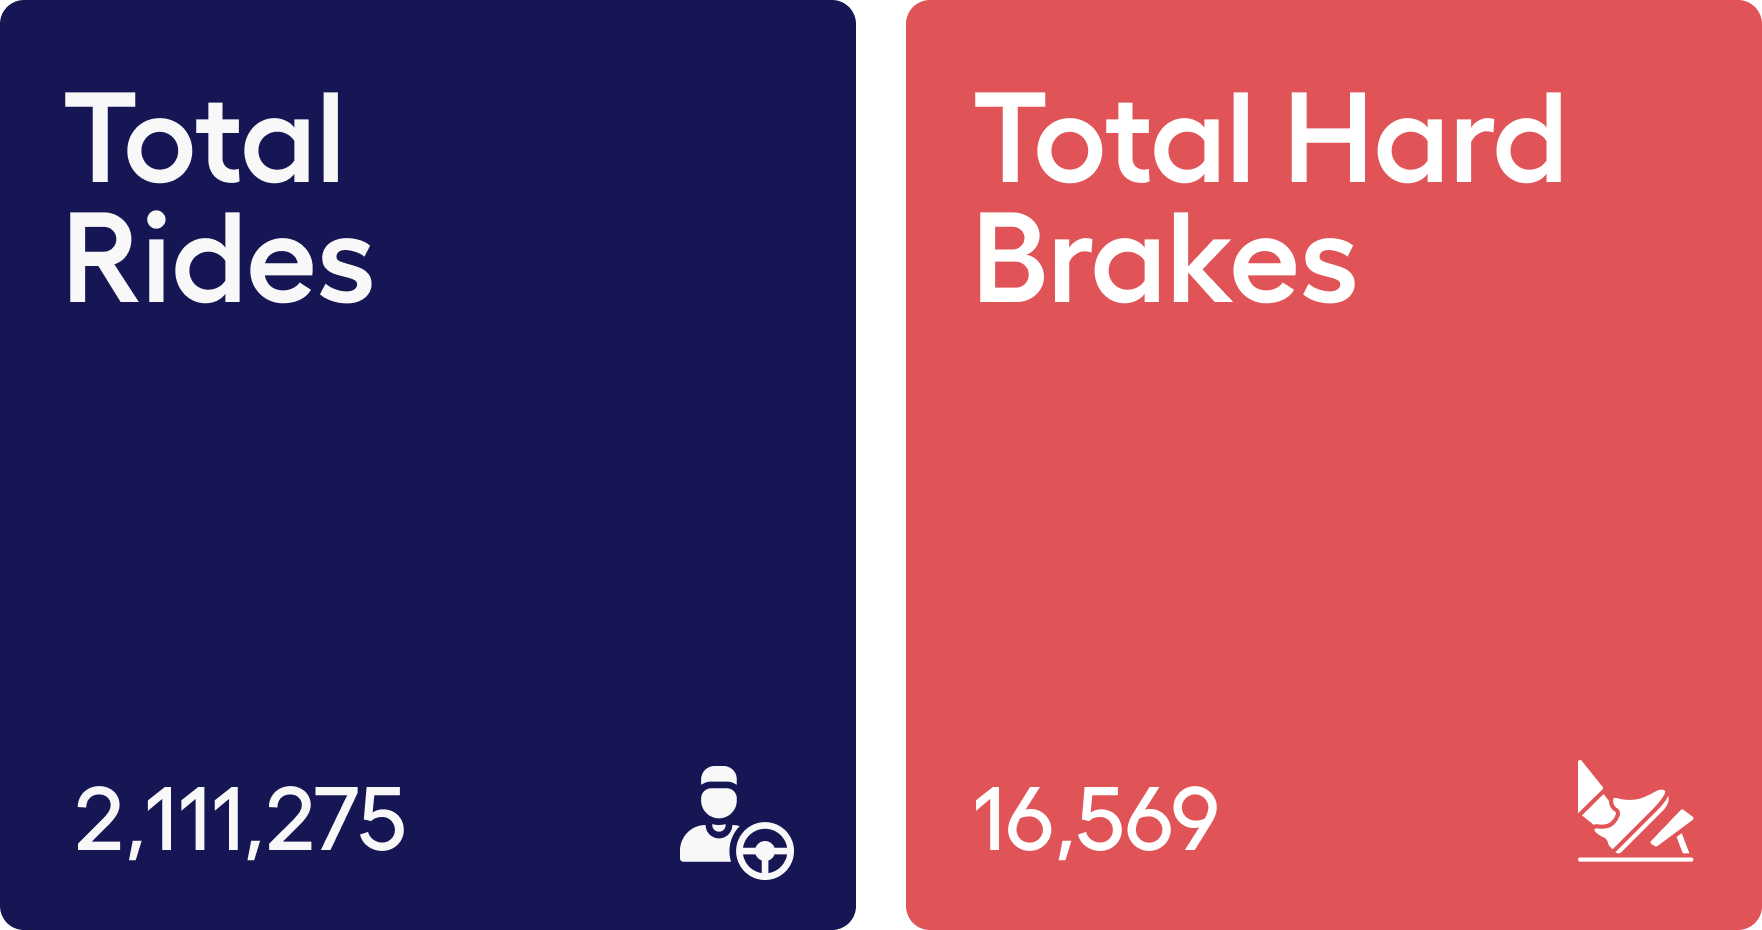
Analysis of 2.1 million rides across 53 US states during the Christmas period reveals distinct traffic and safety patterns, with special focus on the critical 48-hour window of Dec 24-25.
Key Finding
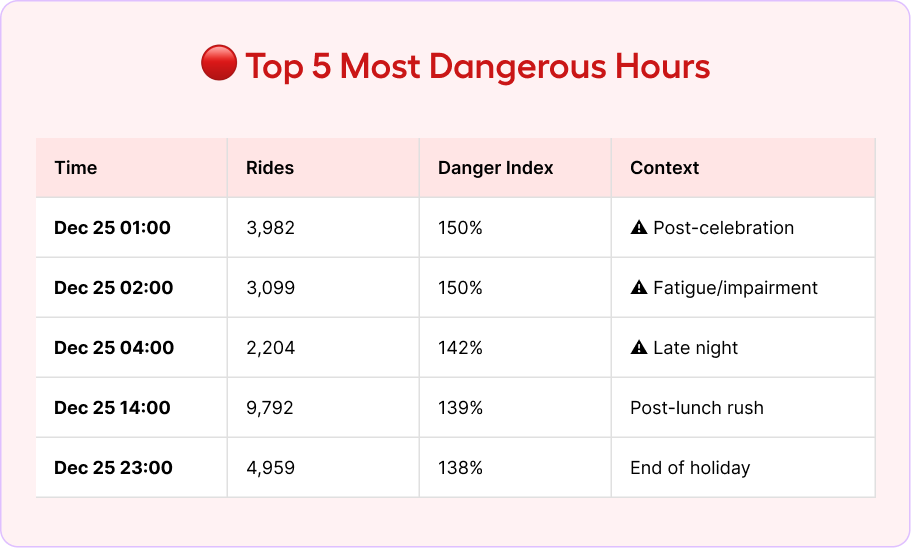
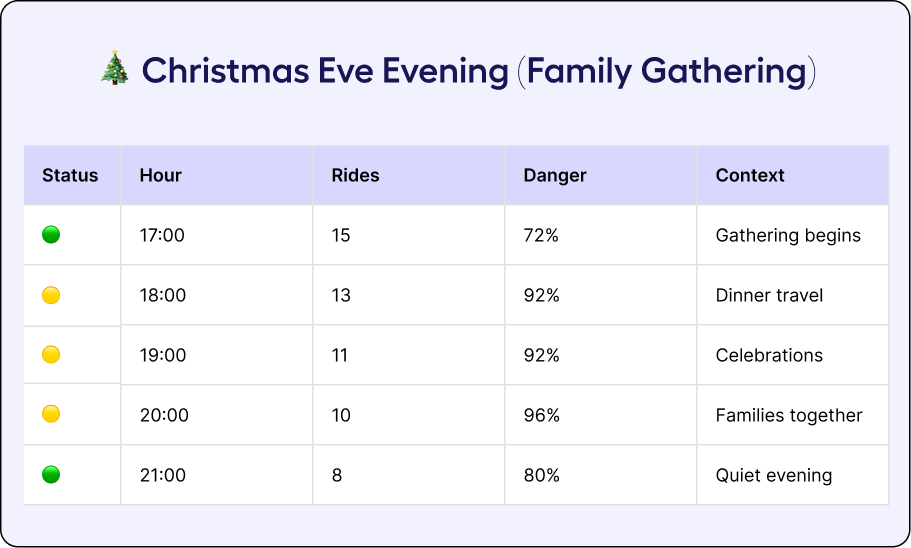
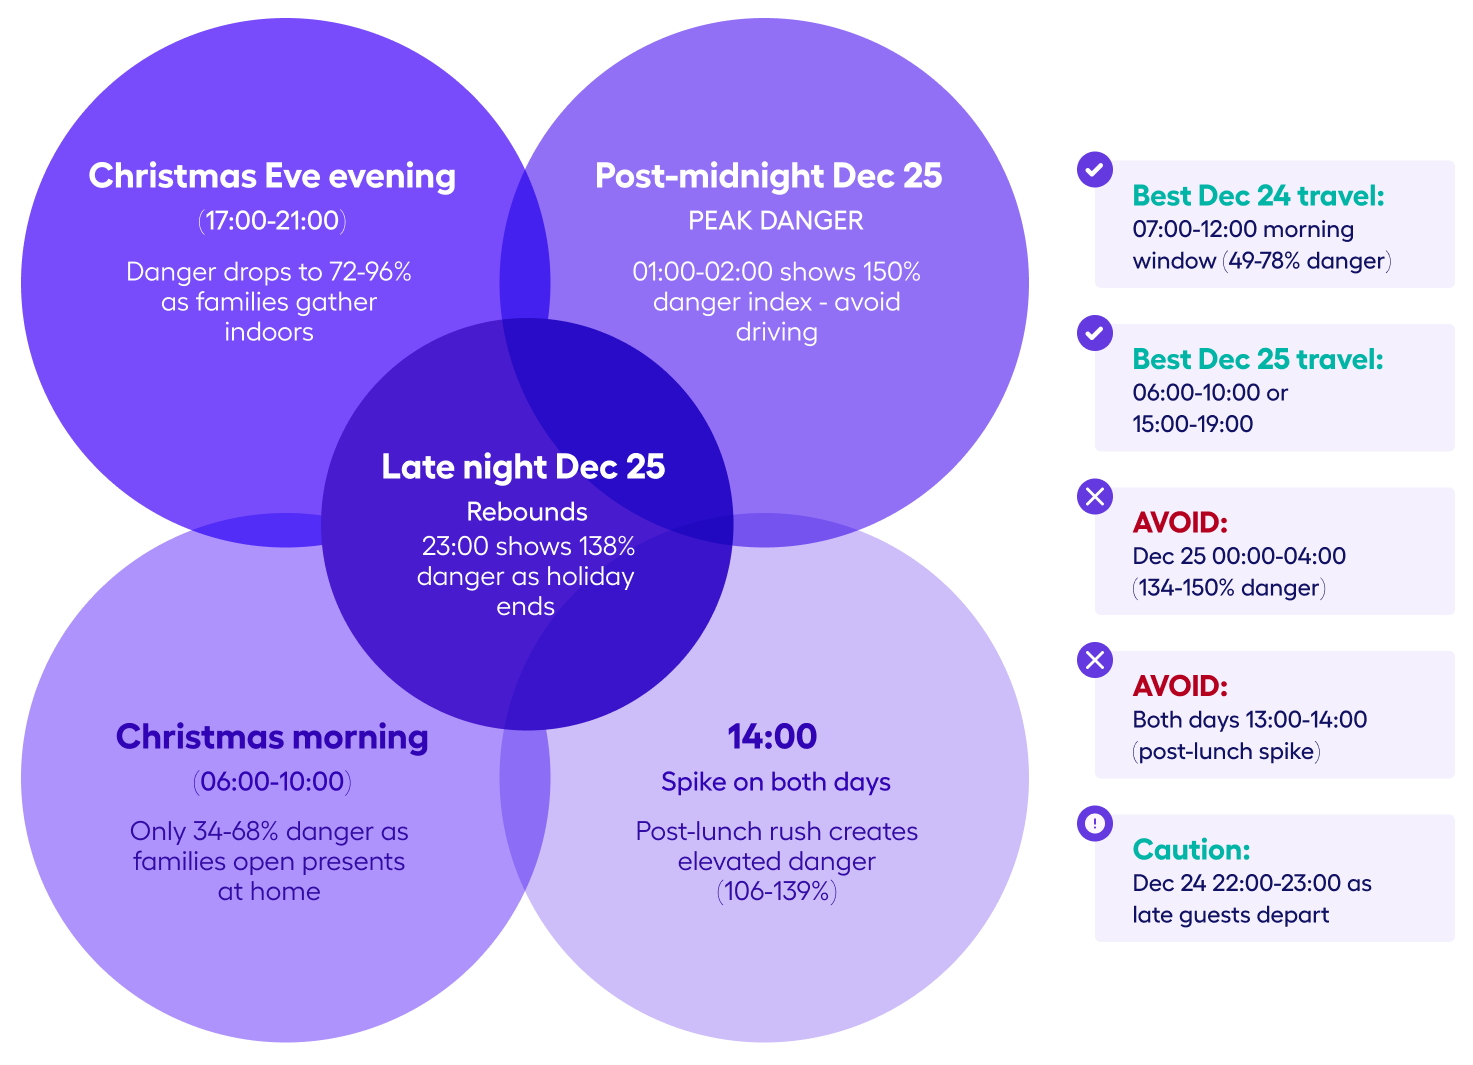
Christmas Eve evening (17:00-21:00) is surprisingly safe as families gather. Post-midnight Dec 25 (00:00-04:00) is extremely dangerous with danger indices up to 150%.
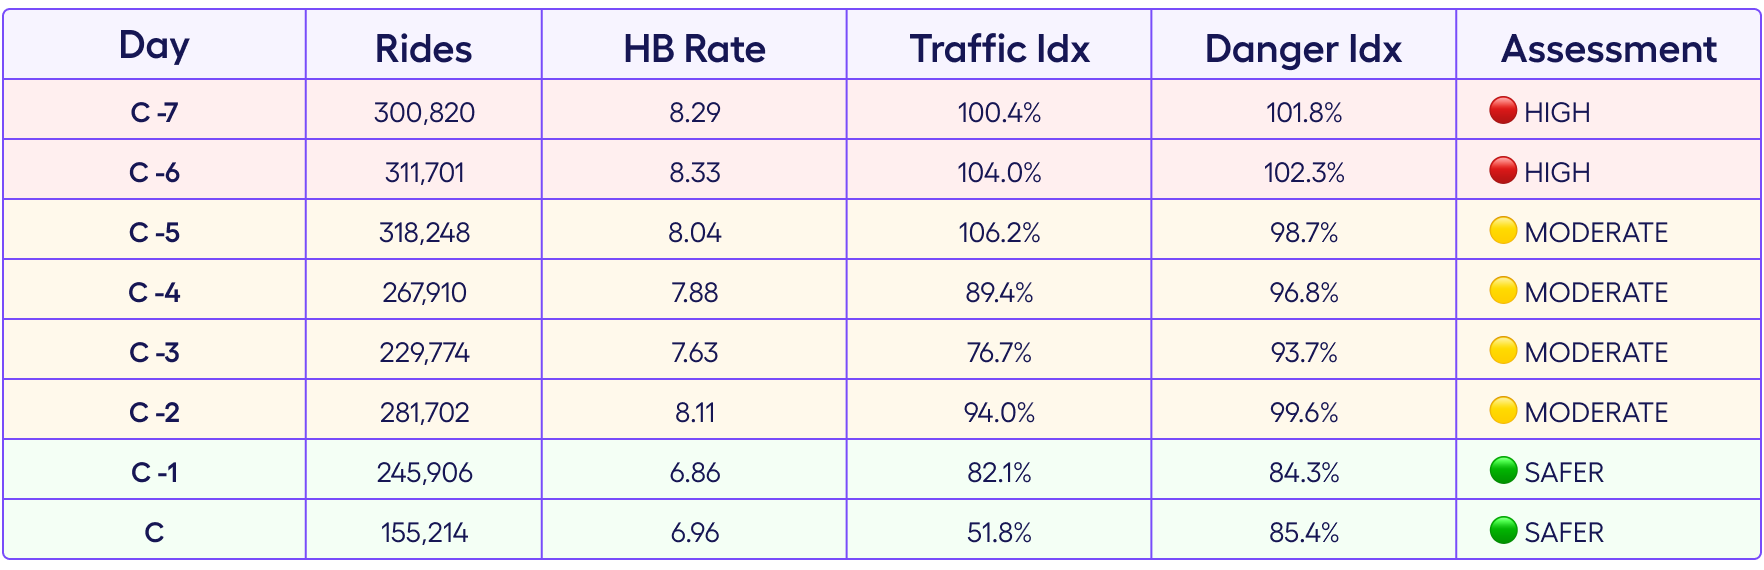
Day-Level Analysis
Baseline: 299,670 rides/day | 8.14 HB per 1,000 rides (avg of C-7 to C-4)
Day Pattern Insights
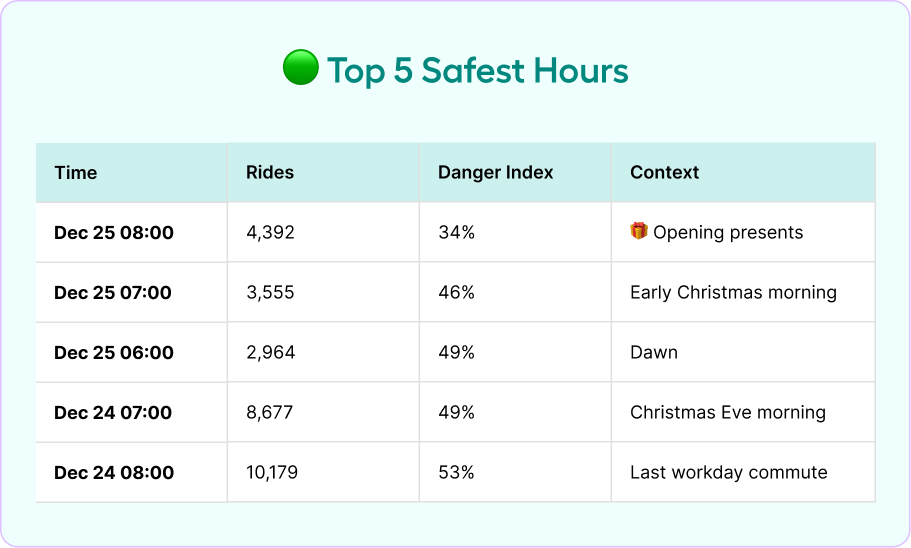
🟢 Christmas Eve & Day (C-1, C): Safest days - 15% below baseline danger despite reduced traffic
🔴 Pre-holiday week (C-7, C-6): Peak danger - busy shopping with above-normal hard brake rates
📊 Traffic decline: From 106% (C-5) down to 52% (C) as families stay home

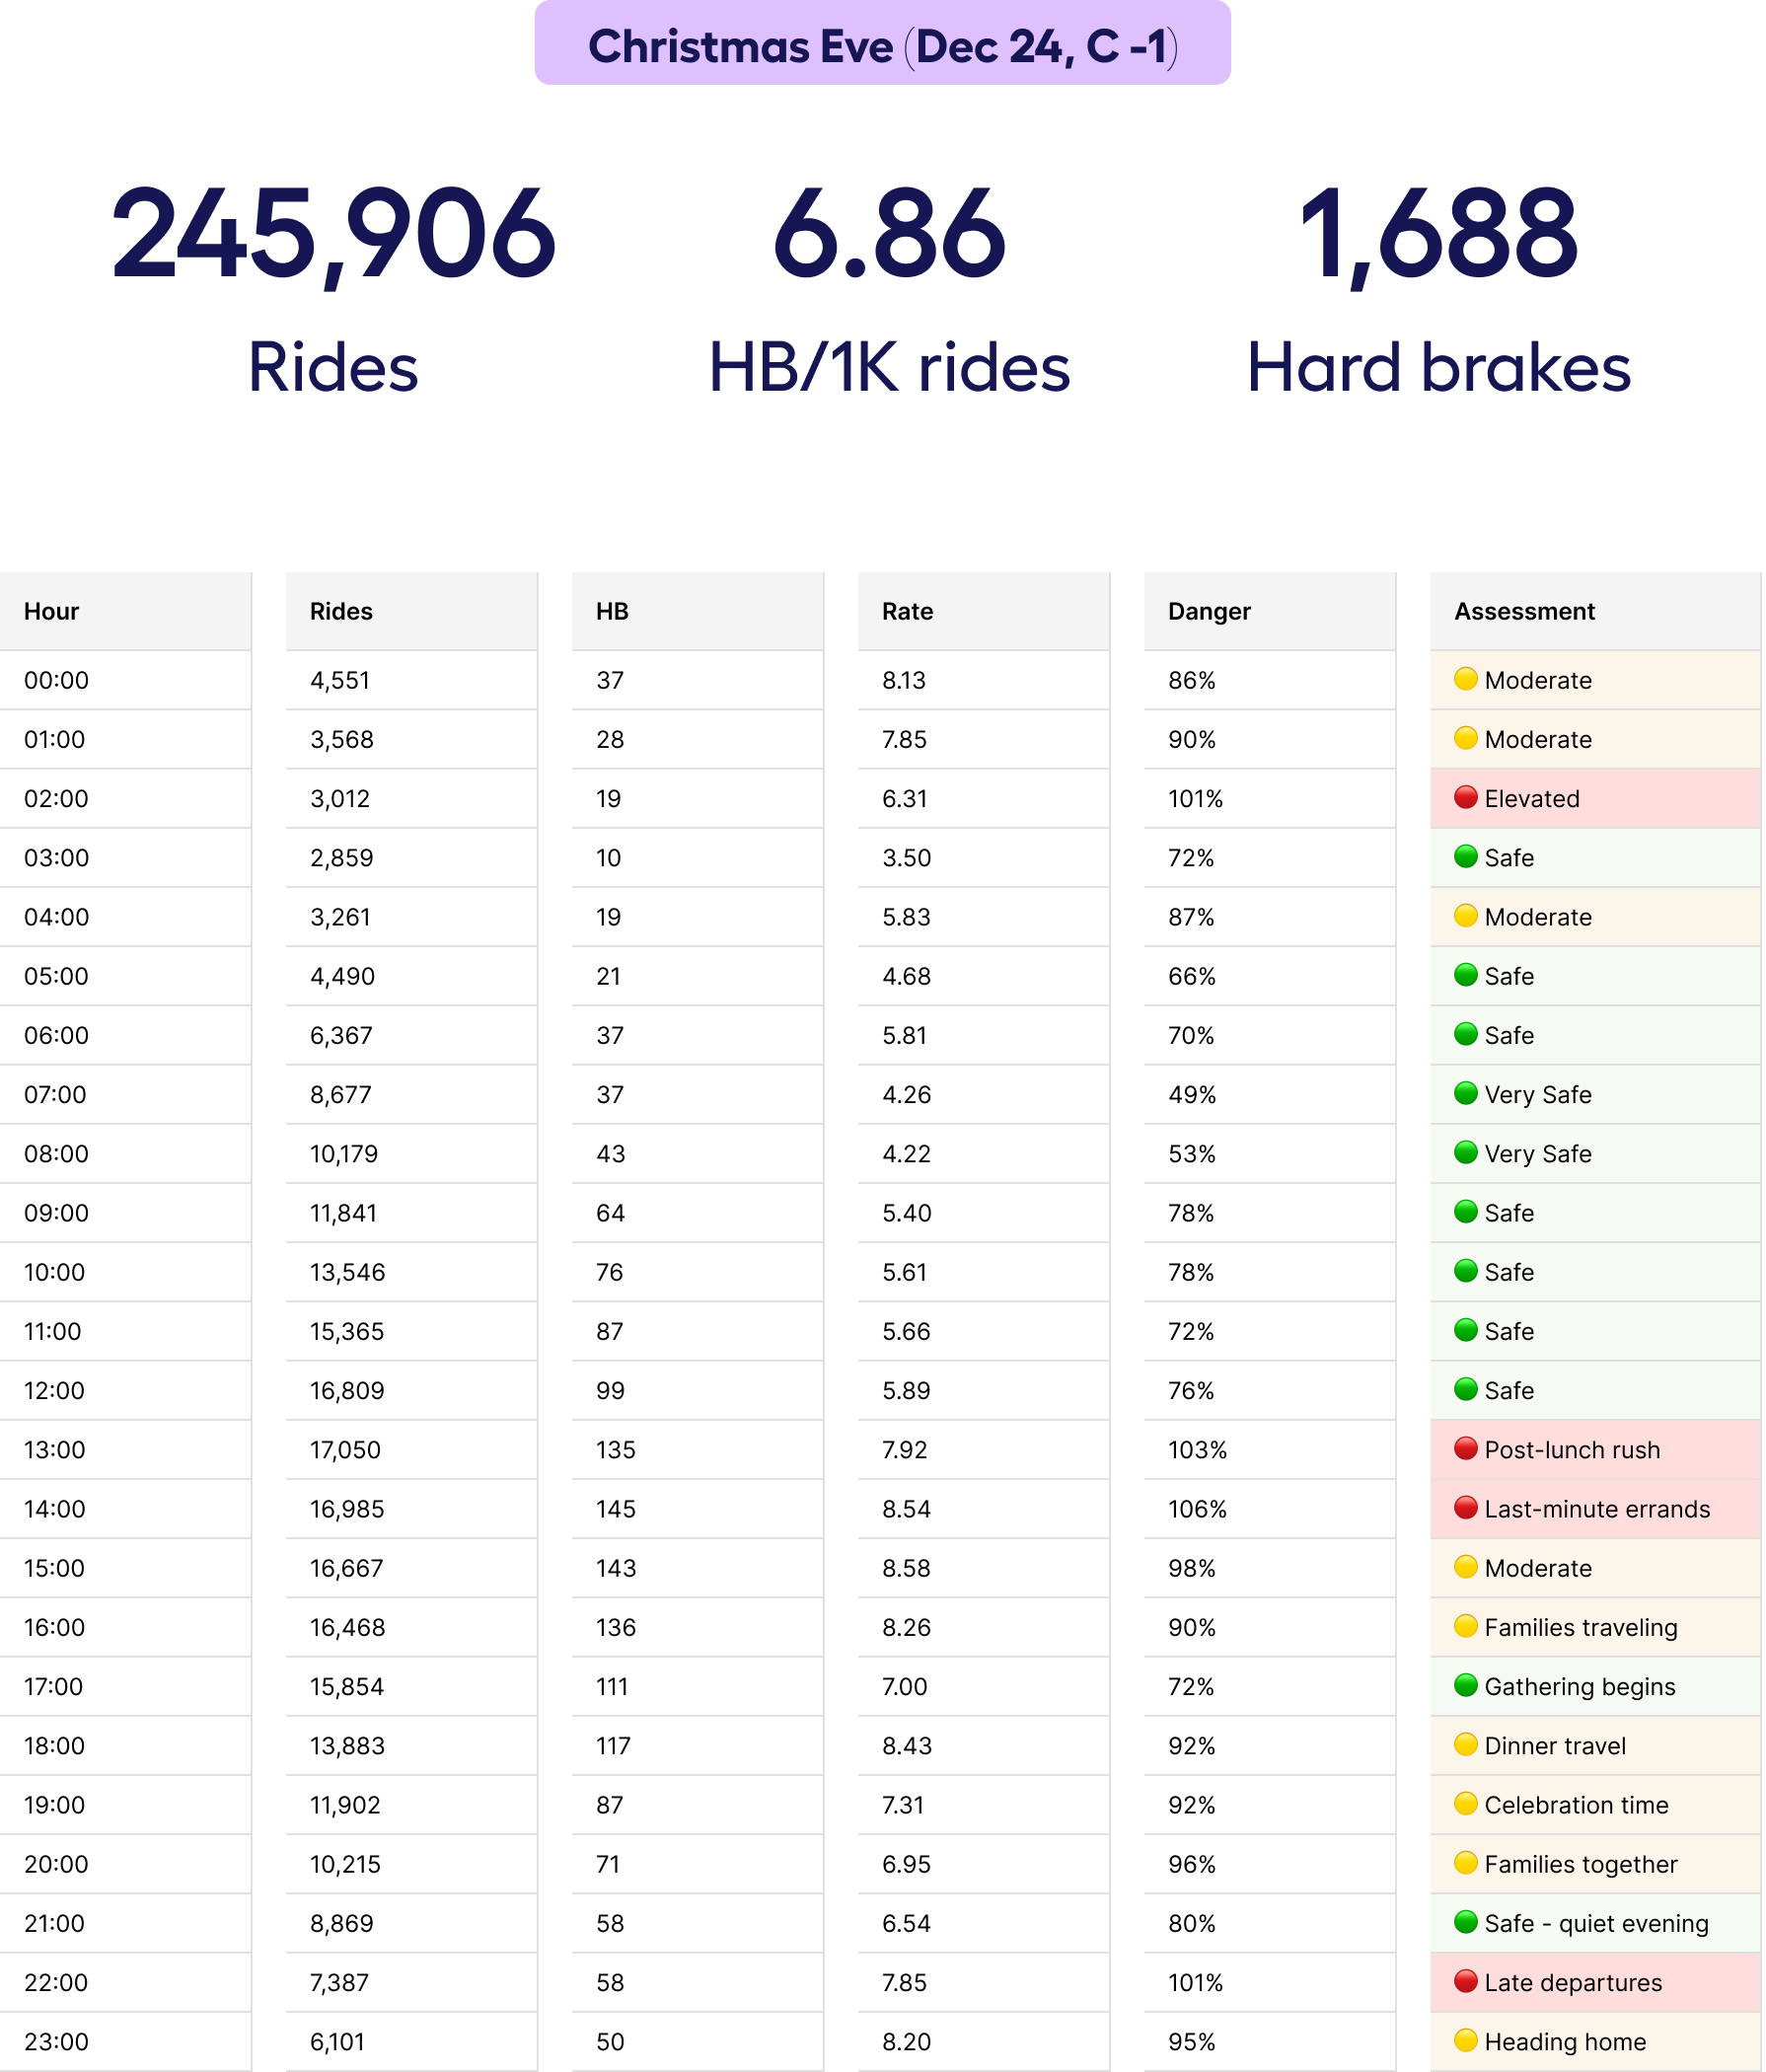
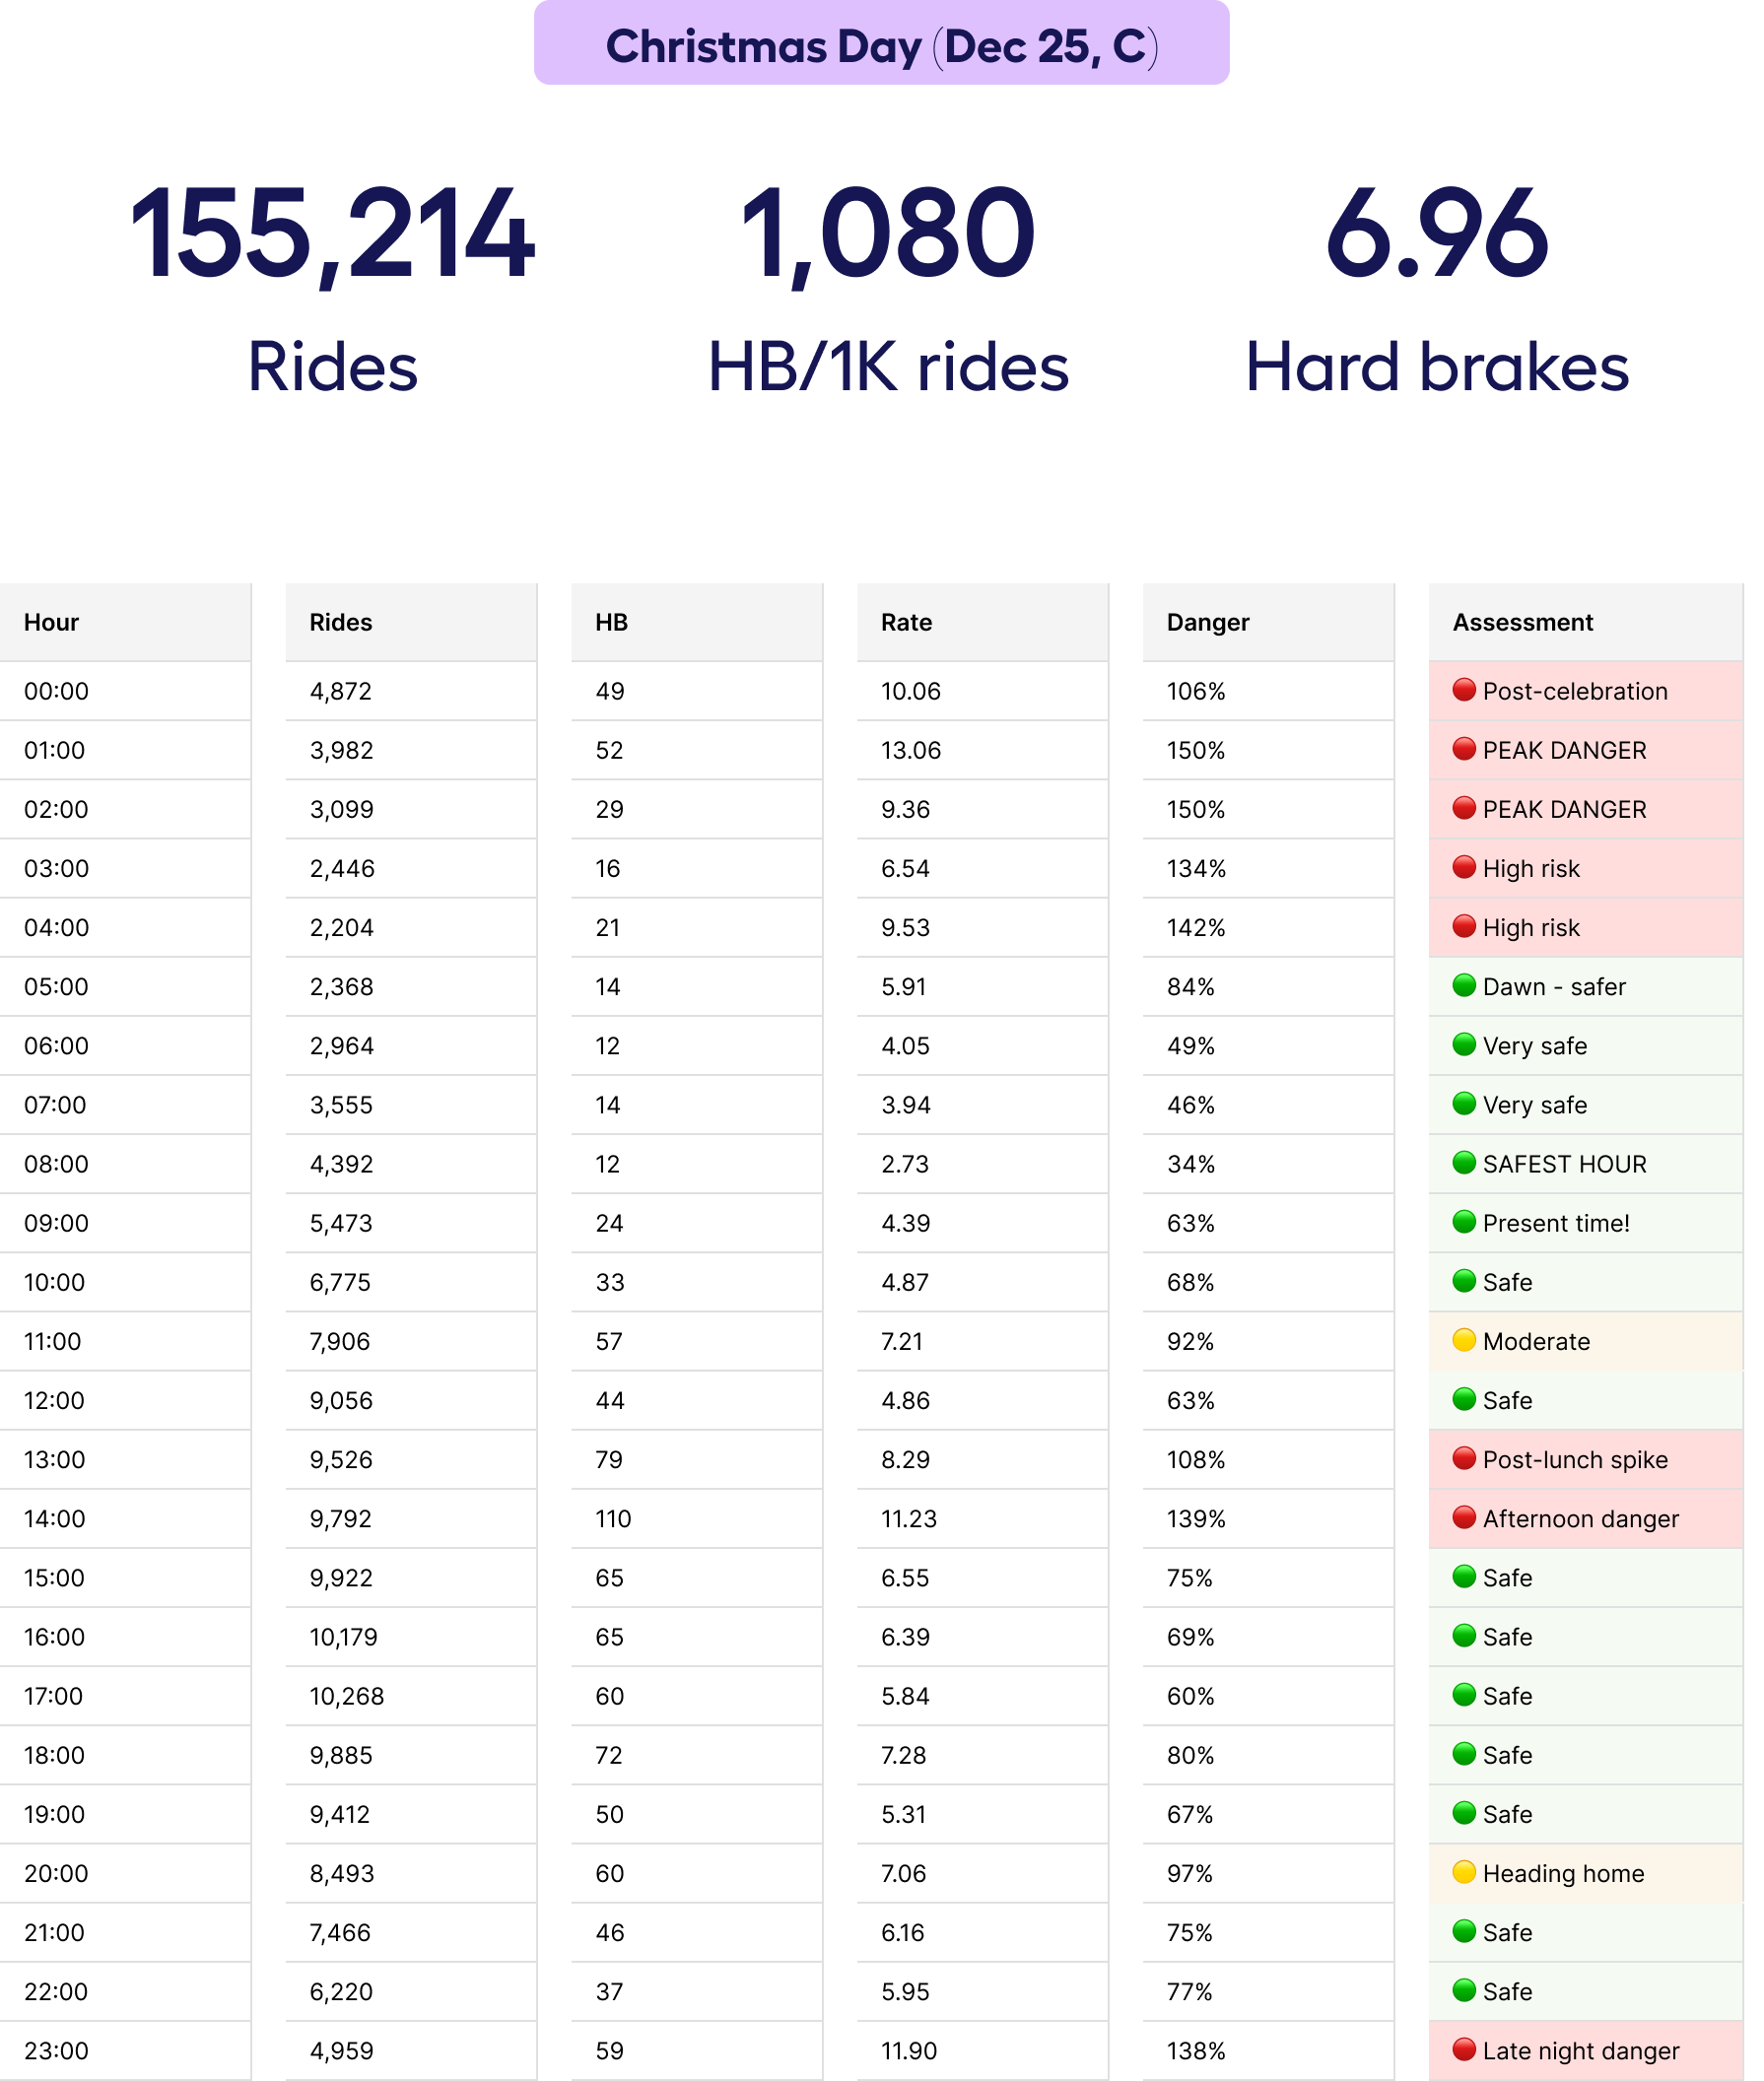
48-Hour Critical Window: Dec 24-25
Detailed hour-by-hour analysis of Christmas Eve and Christmas Day - the core celebration period when families gather.
48-Hour Pattern Summary
Key Findings & Recommendations
Data & Methodology
This analysis is based on Nexar's Ride and Incident data from December 2024.
Developed by
Rui Carneiro, Nexar's BI Lead
Data Source
Nexar's BigQuery Data Warehouse
Location Data
Compared against OpenStreetMap location information
Analytical Model
Developed with Claude AI assistance
Want to dive deeper?
Nexar helps industry leaders turn vision into value. Dive into real-world success stories where our data redefined the road ahead - and see what it can do for you.