Executive Summary
Analysis of 910,363 rides during the New Year period reveals critical safety patterns around the midnight transition.

Critical Finding
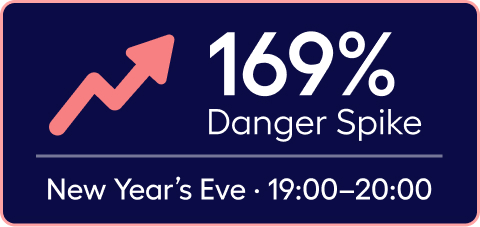
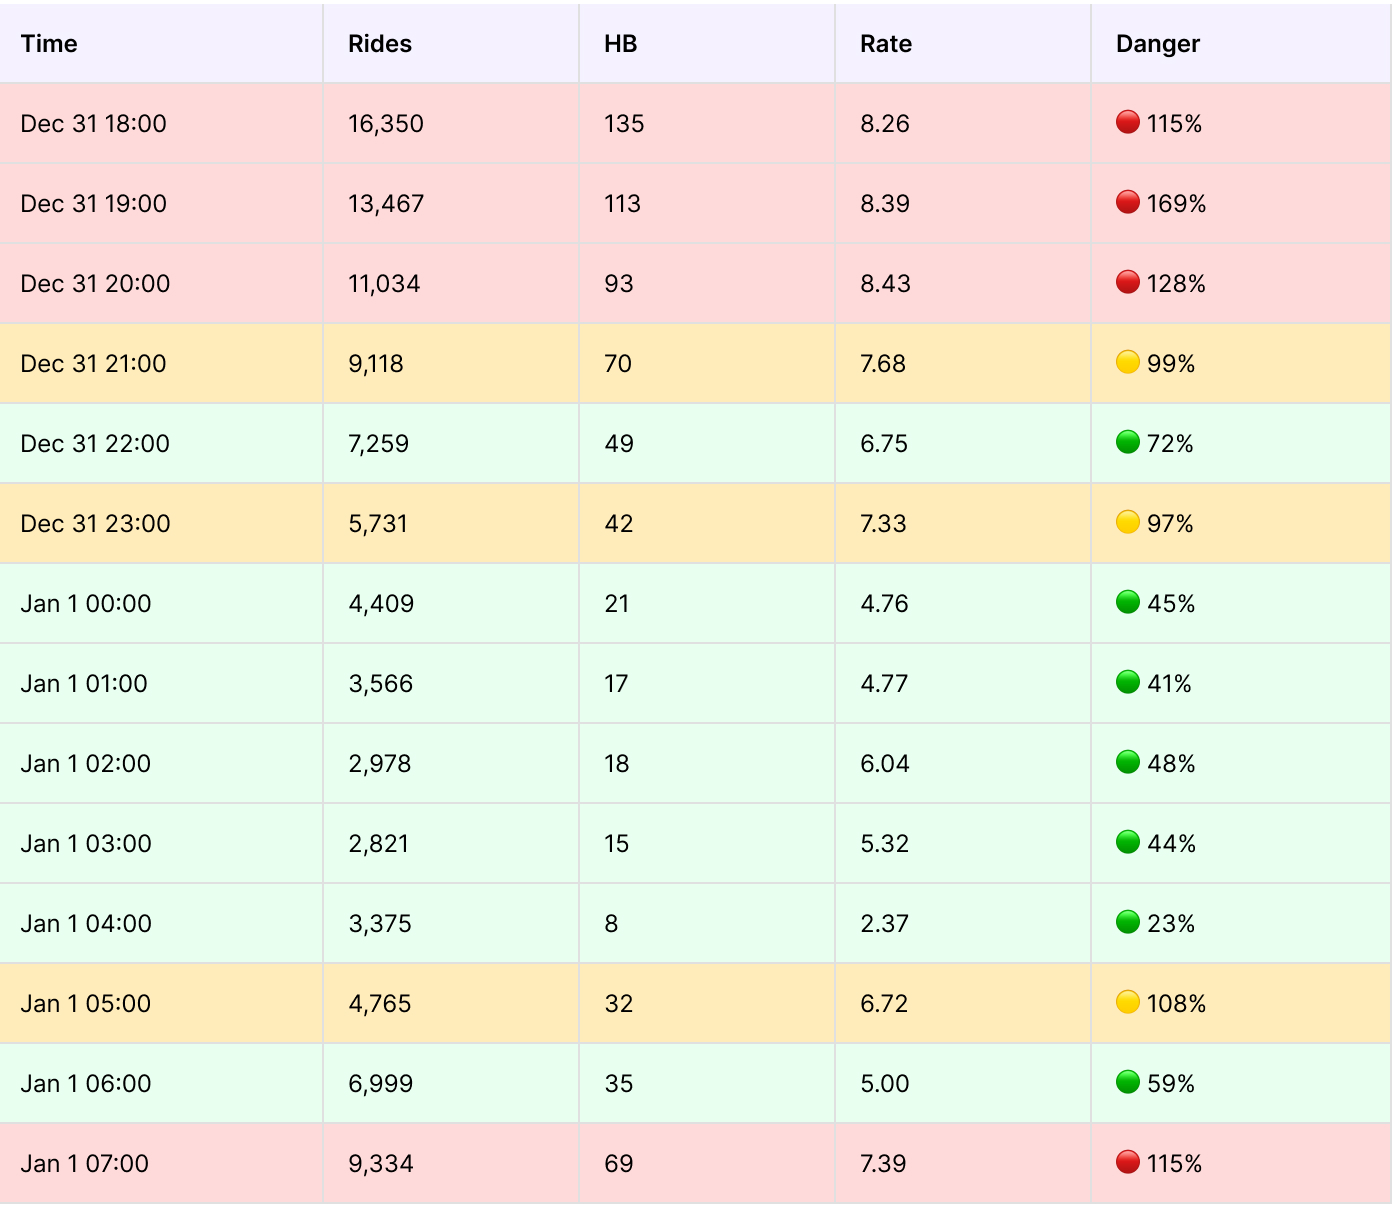
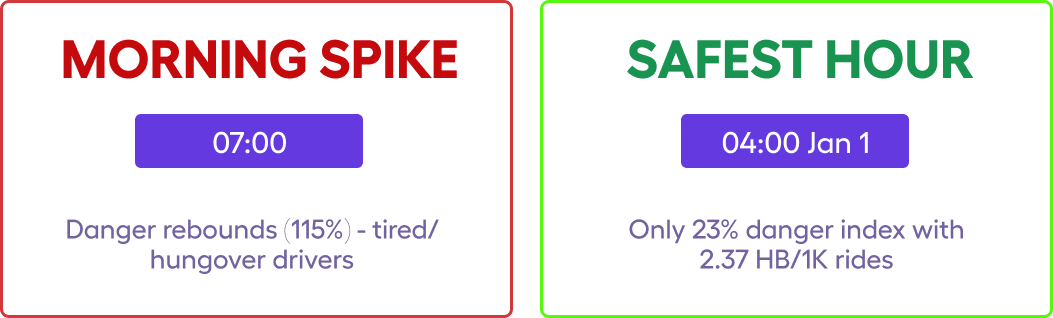
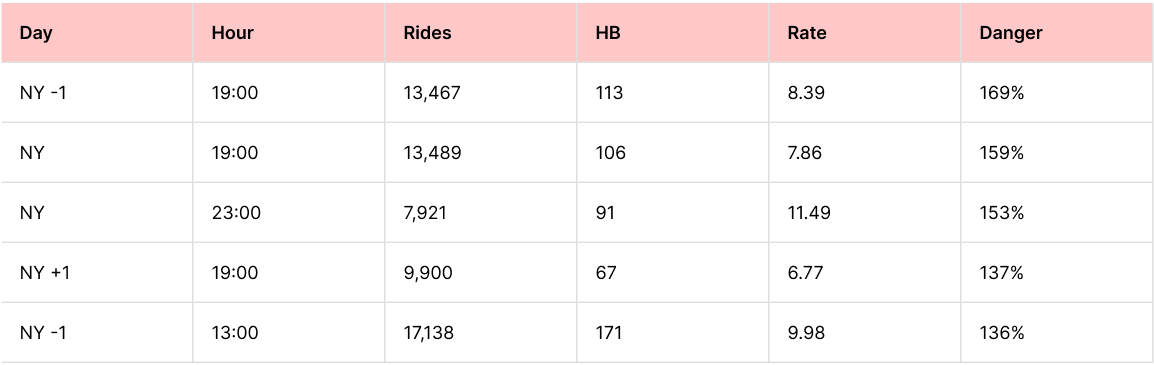
Between 19:00–20:00, danger peaks at 169% as roads fill with last-minute travel, mixed intentions, and time pressure.After midnight, the pattern flips. From 00:00–04:00, danger drops to just 23–48%, driven by significantly reduced traffic volume. High risk doesn’t follow the clock. It follows human behavior.
Day-Level Analysis
Baseline: 195,092 rides/day | 7.48 HB per 1,000 rides

Day Pattern Insights
🔴 NYE (NY -1): Highest traffic (133.5%) AND danger (104.5%) - peak celebration travel
🟡 NY Day: High traffic but danger normalizes (98.5%) - post-midnight caution
🔴 Jan 2 (NY +1): Traffic drops but danger rebounds (103.8%) - fatigue factor

Critical NYE to NY Morning Transition
Hour-by-hour analysis of the midnight celebration period:

Hour-Day Combinations
Most Dangerous Hour-Day Combinations
Safest Hour-Day Combinations

Key Findings & Recommendations

Data & Methodology
This analysis is based on Nexar's Ride and Incident data from December 2024 - January 2025.
Developed by
Rui Carneiro, Nexar's BI Lead
Data Source
Nexar's BigQuery Data Warehous
Location Data
Compared against OpenStreetMap location information
Analytical Model
Developed with Claude AI assistance
Want to dive deeper?
Nexar helps industry leaders turn vision into value. Dive into real-world success stories where our data redefined the road ahead - and see what it can do for you.